


Download software tagged by complex function graphs
|
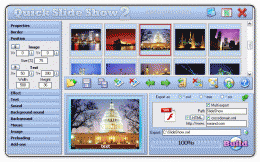
The most popular program: Quick Slide Show 2.00
more info |
|
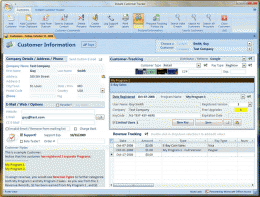
We recommend: Instant Customer Tracker 1.0
more info |
Rank Tracker Enterprise 6.7.1 by Link-Assistant.com: SEO Software
2013-02-05
Rank Tracker Enterprise: an easy-to-use rankings checking product for pros which lets you check site rankings in 633 search engines, track unlimited number of sites, keep history, draw visual progress graphs and create HTML/PDF reports.
Black Box Chart 1.0.0 by Black Box Chart
2008-09-07
Black Box Chart is a fast and easy to use Flash charting component. You can easily embed it on your website to display interactive charts. Official web page: http://www.blackboxchart.com
RadarCube OLAP Chart Windows Forms 2.50.0 by Radar-Soft, L.L.C.
2011-02-24
NET Windows Forms OLAP controls (both Grid and Chart) to add Visual OLAP Analysis to your applications. Displays business data in charts and graphs rather than in numbers. Works with a relational database or MS Analysis Services.
Origramy Flash Graph Component 1.12 by Origramy
2009-05-07
Origramy is a XML-driven flash graph component designed for creating and viewing diagrams and graphs. The component has intuitive customizable multilingual interface, JavaScript support, several export formats and wide data organization ways.
EZ Weight Loss Tracker 2.01 by GoLoseWeight.com
2009-01-03
EZ Weight loss tracker is free software to help you keep track of your hard efforts to lose a few pounds. It features daily entry and great graphs. Very easy to use and also includes a handy calendar/scheduler.
DiagramLite 1.0 by MindFusion LLC
2009-01-26
DiagramLite can be used in Silverlight applications to create and present workflow, flowchart and process diagrams, database entity-relationship diagrams, organizational, hierarchy and relationship charts, network schemes, graphs and trees.
ManageEngine OpManager Voip Monitor 7.2 by AdventNet Inc
2009-01-29
The VoIP Monitor is a VoIP network management solution using Cisco IP SLA technology to monitor key VoIP service performance metrics. Additional in-depth bandwidth utilization graphs also help in quick troubleshooting of poor VoIP performance.
Stock Volatility Calculator 1 by Option Trading Tips
2009-02-10
This is a free spreadsheet that downloads free historical stock data from the Yahoo database into the spreadsheet and calculates the historical (or realized) volatility of the selected stock and graphs the result.
2009-02-21
Copy multiple charts from Excel into a new or existing MS PowerPoint file. Excel 2000 or higher required. MS PowerPoint 2000 or higher required.